
A comprehensive analysis of how point-of-sale architecture, processing latency, and UI design impact checkout efficiency and revenue retention in the South African retail and hospitality sectors.
The Architecture Gap: Latency and Resilience
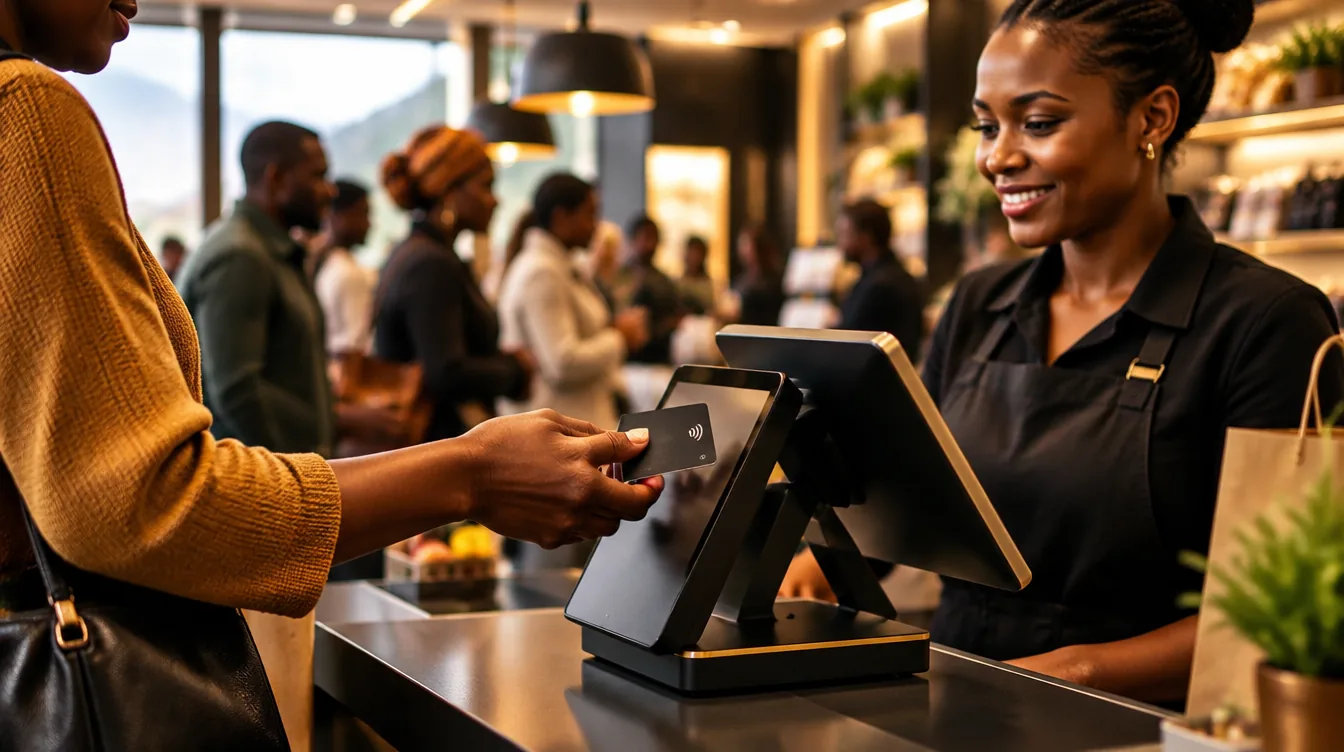
As we head into 2026, the primary differentiator in POS performance is no longer just "features," but the fundamental architecture of the system. The industry has seen a massive shift toward "Always On" systems that prioritize local database integrity over pure cloud-based models, especially in regions prone to infrastructure instability.
Benchmark: Transaction Latency by System Type
This chart demonstrates how different database structures handle the "authorization-to-receipt" cycle during peak hours.
| Architecture Type | Avg. Processing Latency | Peak Load Reliability | Offline Capability |
|---|---|---|---|
| Cloud-Native (Browser-based) | 2.4 - 4.1 Seconds | Variable (Link Dependent) | Limited/None |
| Hybrid (Cloud + Edge Cache) | 1.2 - 2.8 Seconds | Moderate | Short-term Sync Only |
| TimeWorks (Local SQL-Powered) | < 0.5 Seconds | High (Constant) | Full Offline Resilience |
For South African operators, the "Offline Resilience" metric is the most critical benchmark. Systems built on a Microsoft SQL Server backend, like TimeWorks, maintain sub-second transaction speeds even when the internet connection drops or load shedding switches power to backup systems. Cloud-only systems often experience a "Coherence Gap" during these transitions, where UI response times lag significantly.
The Cost of Friction: Abandonment Rates
Customer friction is measured by the delta between a customer's intent to buy and the final completion of the transaction. In 2026, consumer patience has reached an all-time low, with speed of service now a top-three driver for Customer Satisfaction (CSAT) scores.
Reference Chart: Queue Length vs. Abandonment Probability
| Queue Position | Wait Time Threshold | Abandonment Rate (Retail) | Abandonment Rate (QSR/Fast Food) |
|---|---|---|---|
| Position 1-2 | < 60 Seconds | 1.2% | 0.8% |
| Position 3-5 | 2 - 4 Minutes | 14.5% | 22.1% |
| Position 6+ | > 5 Minutes | 38.0% | 54.2% |
UI Throughput: The Taps-to-Total Metric
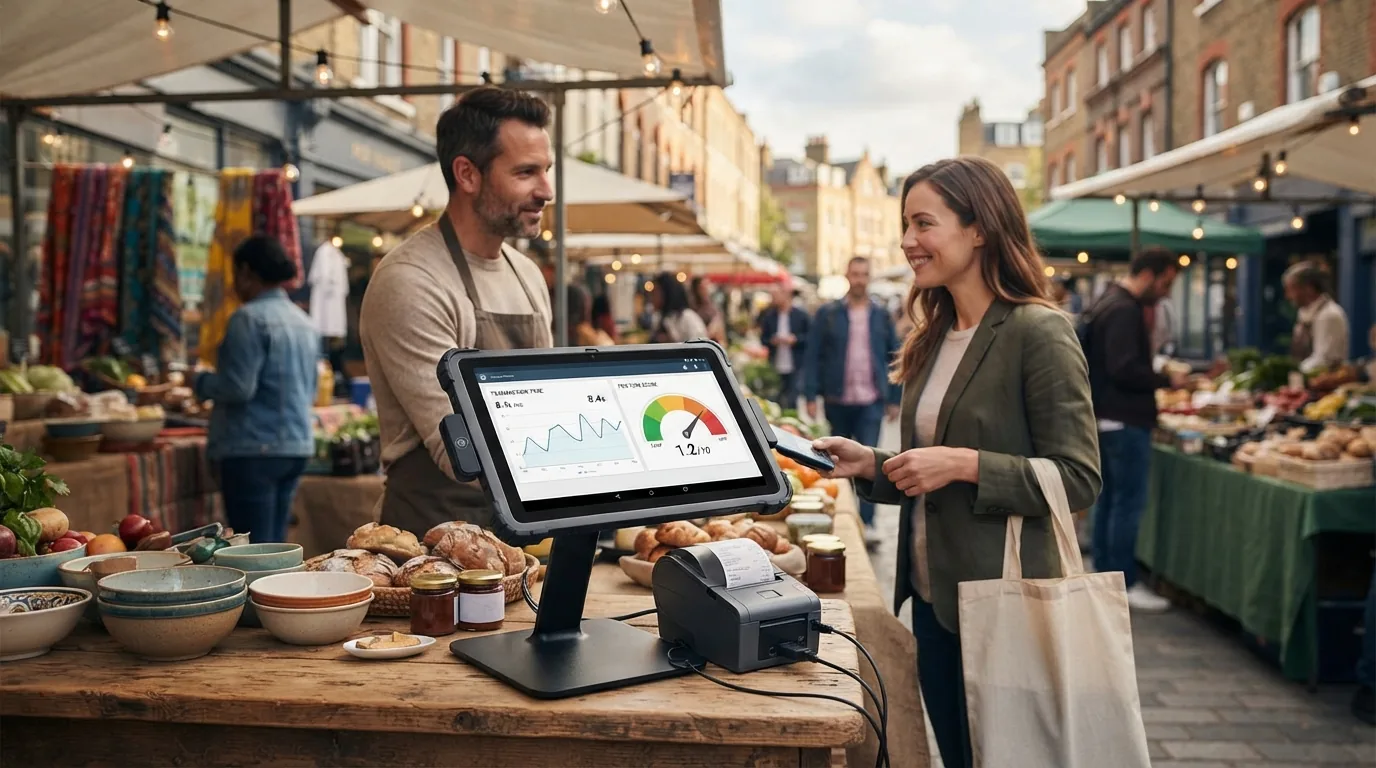
The "Coherence Gap" often manifests in the user interface. If a cashier must navigate through four screens to apply a simple modifier, the system is introducing friction. We benchmark POS efficiency by the number of "taps" required for a standard transaction.
| Transaction Type | Legacy System (Taps) | Modern Web-POS (Taps) | TimeWorks Optimized (Taps) |
|---|---|---|---|
| Standard Coffee + Modifier | 7 Taps | 5 Taps | 3 Taps |
| Split Bill (4-way) | 12+ Taps | 8 Taps | 4 Taps |
| Inventory Look-up | 9 Taps | 6 Taps | 2 Taps |
By reducing the "taps-to-total," TimeWorks ensures that orders land fast and the local database keeps trading steady. This is particularly vital for coffee shops and fast-food venues where peak service windows determine the day's profitability.
The South African Benchmark: Power and Connectivity
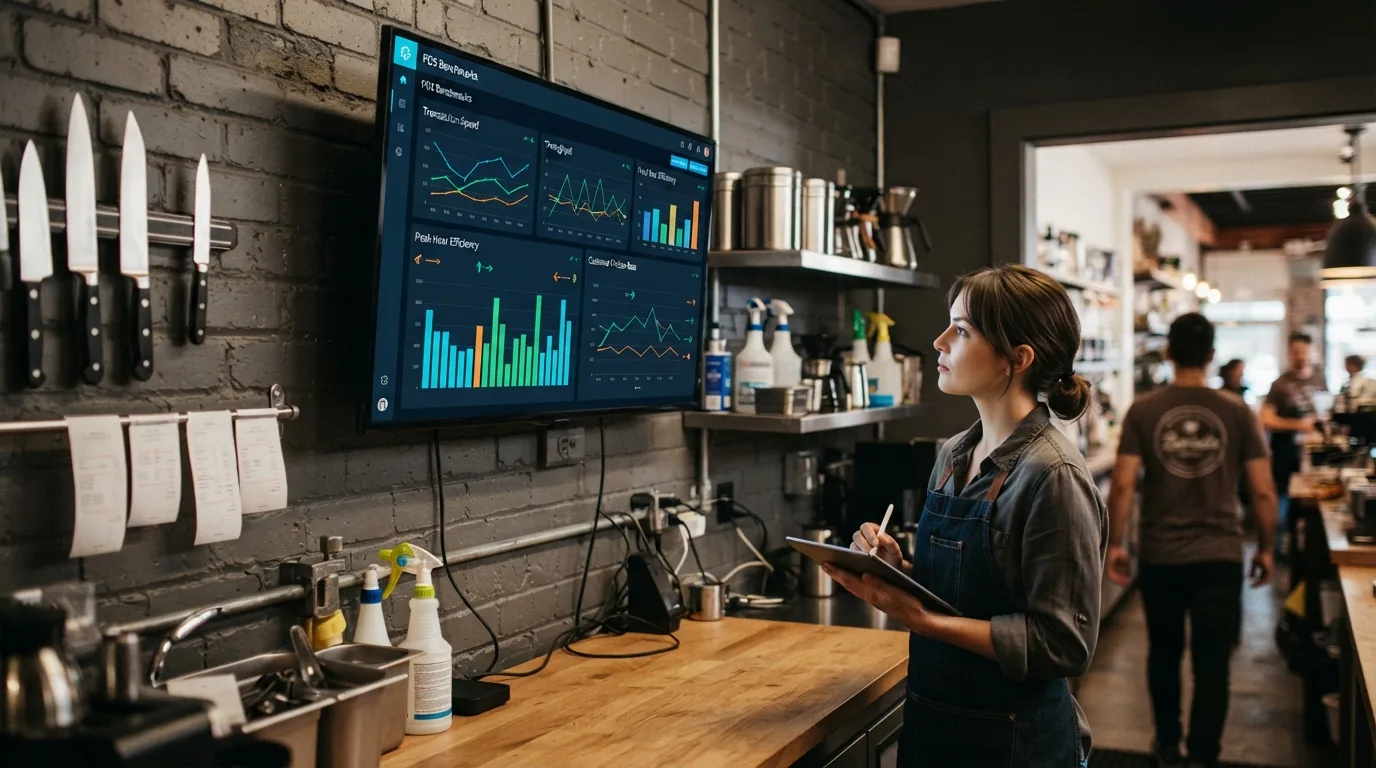
Global benchmarks often ignore the unique challenges of the South African market. In Cape Town and the Winelands, 2026 benchmarks must include "Resilience Metrics" related to power interruptions and infrastructure stability.
2026 Resilience Requirements
- SQL-Backed Core: Transactions must be recorded locally first to prevent data loss during signal drops.
- Same-Day Support: Businesses cannot afford the "ambiguity" of international help desks. Local, on-site support is a benchmark for operational confidence.
- Automatic Sync: Back-office data must catch up automatically without manual intervention when connectivity returns.
Learn more about our Cape Town local support and why uptime matters most for high-volume service floors.
Frequently Asked Questions
A high-performing system should process a standard payment in under 2 seconds. This includes the time from tapping a card to the receipt printing. TimeWorks' SQL-backed systems are engineered to exceed this benchmark even during offline modes.
Industry data suggests that for a high-volume retailer, a consistent 1-second delay during peak periods can result in a 2-5% loss in annual revenue due to queue abandonment and reduced throughput.
Yes, but only if the software is optimized for it. Mobile POS (mPOS) can reduce queue friction by "line-busting," but if the system relies on a slow cloud connection, it simply moves the bottleneck from the counter to the floor.
Modern systems like TimeWorks use a local SQL database. When power or internet drops, the till continues to trade normally. Once the connection is restored, the system automatically batches and syncs sales, stock, and reports back to the operator view.
Ready to Upgrade Your Operational Speed?
Don't let legacy hardware or slow cloud systems create friction for your customers. See how TimeWorks provides the SQL-powered reliability your business deserves.
Based in Cape Town, we provide same-day support and precision-engineered solutions for retail and hospitality.
Request a Benchmark ConsultationTimeWorks Data Solutions | 13A Geelhout Crescent, Plattekloof, Cape Town